The Chopin Alveograph Test Explained: Measuring Flour Strength and Rheological Properties
The Chopin Alveograph is a precision laboratory instrument used to analyze the rheological performance of flour. By inflating a dough sample into a bubble until it bursts, the test provides a theoretical profile of a flour’s strength and the balance between elasticity and extensibility. This article explains what the Alveograph test is, its resulting P, L, and W values, and its specific limitations when applied to different wheat varieties
What is the Alveograph Test
The Alveograph (often referred to as the Chopin Alveograph after its inventor, Marcel Chopin) is a precision laboratory instrument used to analyze the rheological performance of flour – specifically how it flows and deforms under pressure.
While the protein content of a flour tells you how much gluten could potentially form (gluten quantity), the Alveograph test demonstrates how that gluten actually behaves when subjected to physical stress (gluten quality).
The primary purpose of the test is to evaluate the dough’s ability to withstand the internal pressure created by CO2 gases during fermentation. It provides a scientific measurement of the flour’s “strength,” as well as its specific balance of resistance and elasticity.
Ultimately, the Alveograph helps determine how resilient a flour is to fermentation; the stronger the flour appears in this test, the longer the fermentation it can typically withstand without the dough structure collapsing.
It is important to note that while this test is considered the “gold standard” in Italy and France, it is used much less frequently outside of Europe. This distinction is critical for understanding why some flour bags (like Italian 00 flours) provide a “W” rating while others (like American Bread Flour) do not.
The Mechanics of the Alveograph’s “Bubble Test”
To obtain these measurements, the Alveograph performs a standardized “bubble test” that simulates the expansion of gases within a dough structure:
- Preparation: A sample of flour is mixed with a specific salt-water solution to create a dough with a fixed hydration.
- Inflation: Five small, flattened discs of this dough are placed in the machine. A pump then injects air underneath the disc, inflating it into a bubble.
- Measurement: As the bubble expands, a sensor records the air pressure and the volume of air held until the bubble eventually bursts.
The data from these five tests is averaged and plotted on a graph known as an Alveogram. The shape of the resulting curve is what defines the flour’s key values: P, L, and W.
P, L, and W Values: Understanding the Alveogram
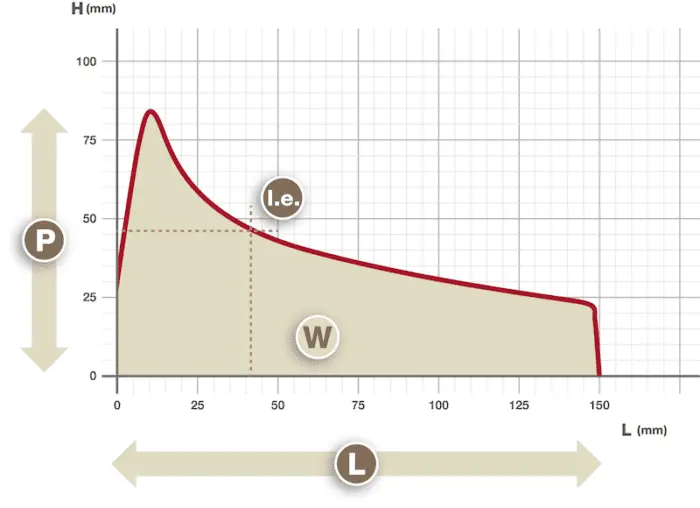
The data captured during the “bubble test” is translated into three primary values: P, L, and W.
Together, they tell the story of how the dough will handle when you stretch it, and how much pressure it can take before it tears.
P (Pressure/Elasticity)
The P value represents the maximum pressure required to deform the dough. It is the peak height of the Alveogram curve.
- A high P value indicates a “tenacious” or resistant dough. While often associated with high protein content, a high P also means the dough is very elastic – it wants to snap back to its original shape rather than stay stretched.
L (Length/Extensibility)
The L value measures the length of the curve, representing how far the dough bubble stretched before it burst.
- A high L value means the flour has excellent extensibility. For a pizza making, this is the quality that allows you to stretch a dough thin without it springing back or tearing.
The P/L Ratio: The Balance of Elasticity and Extensibility
The relationship between P and L is often more telling than the individual numbers themselves.
The P/L ratio describes the balance between elasticity (resistance) and extensibility (stretch).
- P/L = 1.0 (Balanced): The dough has an equal balance of elasticity and extensibility.
- P/L < 1.0 (Extensible): The dough is more “stretchy.” It is easy to open but may become too slack if the ratio is too low (below 0.40). The lower the ratio, the more extensible (stretchy) the dough is.
- P/L > 1.0 (Elastic/Resistant): The dough is “tough” and rubbery. It will likely resist stretching and try to shrink back when stretched. The higher the ratio, the more elastic (resistant) the dough is.
Most Italian mills publish P/L values directly on their websites or within their product catalogs. If you can’t find it there, you can try searching for the flour’s technical data sheet (or ‘scheda tecnica‘).
For pizza making, the ideal P/L ratio typically falls between 0.45 and 0.60. This specific range provides the ‘sweet spot’ for pizza: the dough is extensible enough to stretch into a large base with ease, yet retains enough elastic strength to hold its shape without tearing.
Italian flours are particularly renowned for their ideal P/L ratio for pizza, resulting in highly extensible doughs.
The W Index: The “Strength” Rating
The W rating (often called the “bread baking index”) represents the total area under the Alveogram curve. Mathematically, it is the energy required to burst the dough bubble.
In practical terms, W is the overall strength of the flour.
Generally, flours with a higher W index can withstand longer fermentation and produce a larger volume, because the gluten network is strong enough to trap and hold more fermentation gases without collapsing.
However, the W index must always be viewed alongside P and L; a high W flour with a very high P/L ratio might be so tough that it’s difficult to work with despite its “strength.”
Note: Contrary to popular belief, a higher W index does not necessarily correlate with higher water absorption. The actual water-holding capacity is dictated by other factors, such as protein content, damaged starch and ash content – rather than the W rating itself.
W Rating Reference Table
The W index typically ranges from 45 (extremely weak) to over 400 (very strong).
| W Value | Flour Strength | Best Uses |
| 120 or lower | Very Weak | Generally not suitable for baking. |
| 120 – 160 | Weak | Biscuits, crackers, and short-crust pastries. |
| 160 – 250 | Medium | Baking goods that do not require a strong dough or large volume, such as soft rolls/buns and various pastries. |
| 250 – 310 | Strong | Bread and pizza making. |
| 310 or higher | Very Strong | Baked goods that require full strength and high elasticity (such as Panettone). |
Limitations of the Alveograph Test
It is important to note that the Alveograph, and the resulting W rating, was specifically designed for European soft wheats, which generally have lower protein content than North American wheat.
Consequently, its use is primarily concentrated in Europe (specifically France and Italy). Outside of these regions, the W rating is rarely published, and is often restricted to “pizza flours” for marketing purposes, to appeal to bakers accustomed to Italian standards.
Soft Wheat vs. Hard Wheat
The Alveograph is essential for soft wheat because there is often no direct correlation between protein content and gluten quality.
Two different flours can both contain 11% protein, but behave completely differently; one might be strong enough for pizza, while the other is only suitable for biscuits. The Alveograph solves this by measuring how the gluten actually performs under pressure, allowing millers to distinguish between flours that look identical on a nutrition label.
Conversely, hard wheats (common in the US and Canada) typically show a direct correlation between protein content and gluten strength. In these flours, protein quantity serves as a reliable indicator for quality; as the protein content rises, dough strength increases predictably.
Because the protein count alone provides a clear indication of performance, the W rating becomes redundant – which is why this metric is rarely published outside of Italy and France.
Technical Limitations
The Alveograph is not a “one-size-fits-all” tool. Because it was specifically designed for the low-protein Italian wheat, it can’t provide accurate results for high-protein hard wheats:
- Inconsistency: Stronger, high-protein doughs can be too resistant for the “bubble test,” leading to unreliable or “off the charts” readings.
- The Hydration Bias: As mentioned earlier, the Alveograph uses a fixed hydration (around 50%). Hard wheats usually require much more water to hydrate properly; testing them at 50% makes them appear unnaturally “tough” and elastic (High P), which doesn’t reflect how they would actually behave at a proper baking hydration.
For these reasons, laboratories testing stronger, high-protein flours typically prefer the Farinograph, which measures the torque required to mix the dough over a longer period, providing more accurate data for flours made of hard wheat.
Key Takeaways
- Measuring “Gluten Quality”:
While a nutrition label tells you protein quantity (%), the Alveograph measures protein quality – specifically how a dough deforms and resists pressure when stretched. - The “Bubble” Mechanics:
The test simulates the expansion of CO2 gases by inflating a dough disc into a bubble. The pressure required to inflate it and the volume it reaches before bursting define the flour’s characteristics. - W (The Strength Index):
The W value represents the total energy needed to burst the dough bubble. A higher W generally indicates a stronger flour capable of enduring longer fermentation times. - The P/L Ratio:
P (Tenacity) measures the dough’s resistance and elasticity, while L (Extensibility) measures its ability to stretch without tearing. The P/L ratio defines the dough’s elasticity/extensibility “profile” – whether it will be easy to stretch, or stubbornly “snap back.” - Regional Context & Limitations:
The Alveograph is essential for European soft wheats where protein content is typically a poor predictor of strength. For North American hard wheats, where protein quantity and quality are directly correlated, the test is less common and often less accurate due to technical limitations. - Italian Standardization & Marketing:
The Alveograph is used almost exclusively by Italian and French mills. Outside of these regions, the W rating is rarely published; when it is, it is primarily for marketing purposes.
Enjoyed this article? Join the BLAB
Unlock the Key Takeaways above and enjoy a 100% clean, ad-free experience across the entire site.